Gain deeper insights
Comprehensive knowledge to drive success and take your business to the next level.

0 %
of providers cannot collect a patient balance within 30 days
0 %
of providers cannot collect a $400+ patient balance in 30 days
0 %
median for total A/R over 120 days in multispecialty practices
Turn data into action
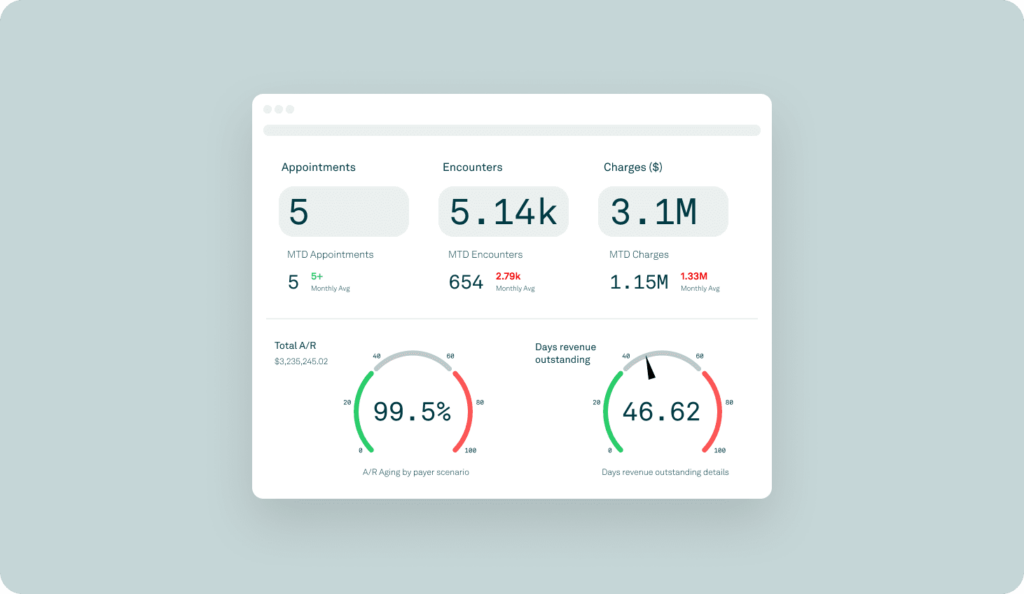
Review always up-to-date reports
Tebra provides, maintains, and updates a list of key reports that you can use immediately or build upon to serve your needs.

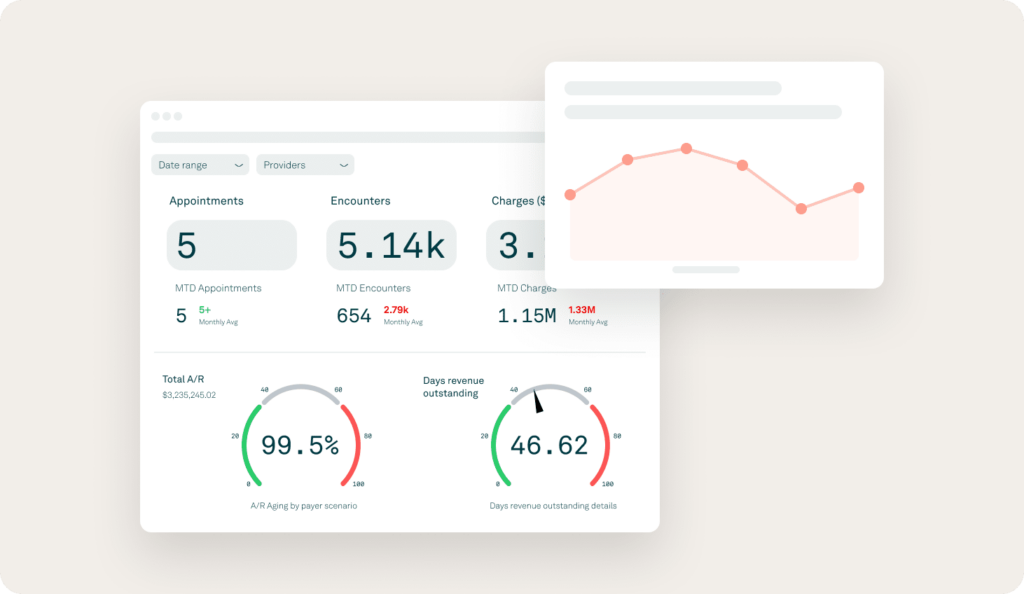
View all practices and providers
All your clinical and billing data — for all practices and providers — is at your fingertips for discovery and analysis.

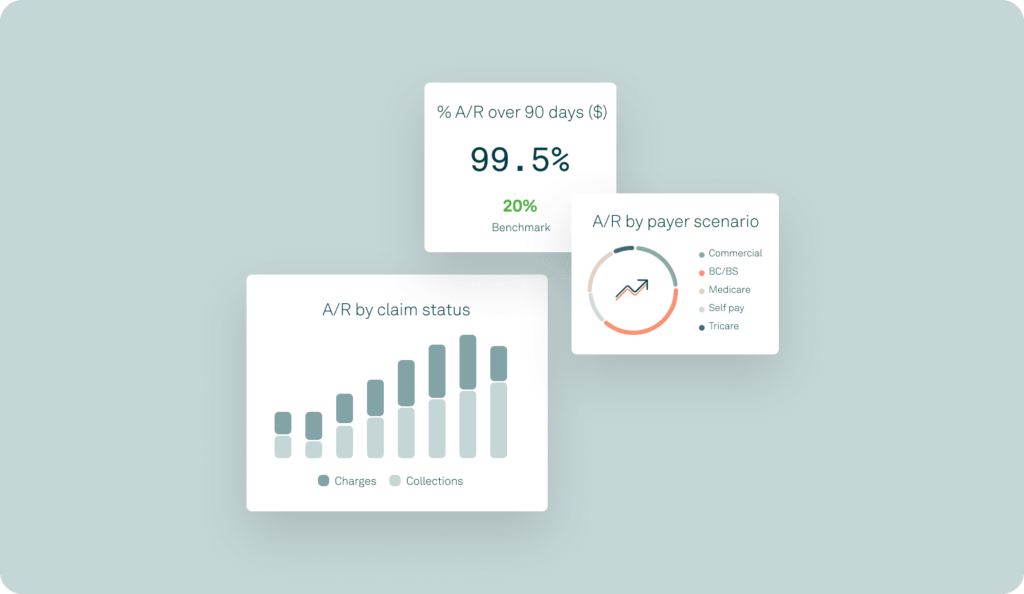
Customize standard reports and dashboards
Any standard report or dashboard can be completely customized, including labels, charts, table columns and rows, formulas, and benchmarks.
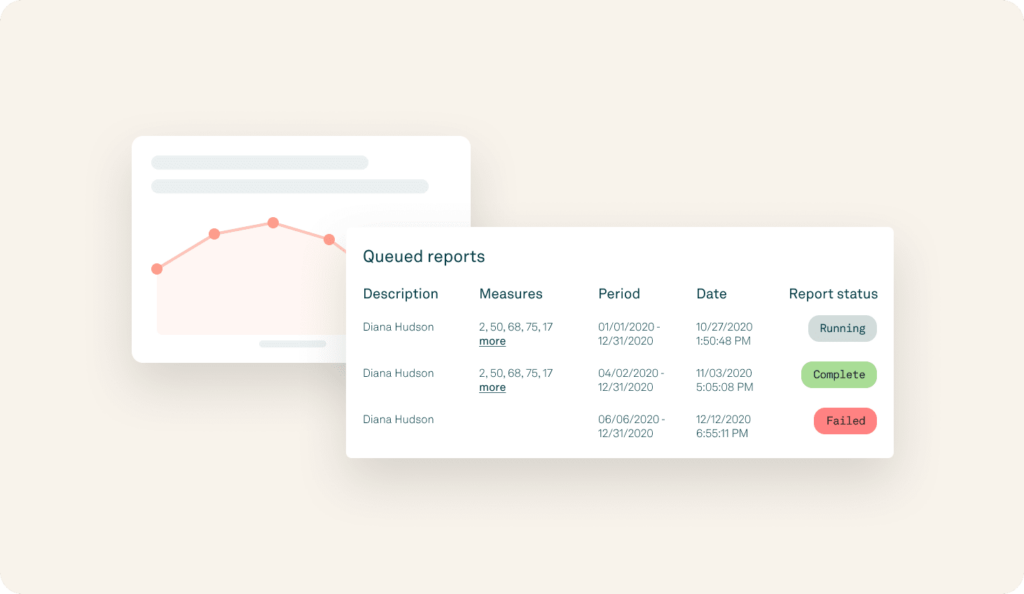
Build your own reports
Build your own data investigation, analysis, visualization, communication, data extracts, and more.
Access and export source data
Source data (claim-level rows used for any chart or calculation) is always accessible and exportable for you to analyze, investigate, or use as a work list.
Bookmark your favorite views
Save any set of filters on any report and jump back to them with one click.

Develop data-driven stories
Take a snapshot of any chart or table (filtered or default views), or even drop live reports into an in-app presentation, to facilitate sharing your discoveries.
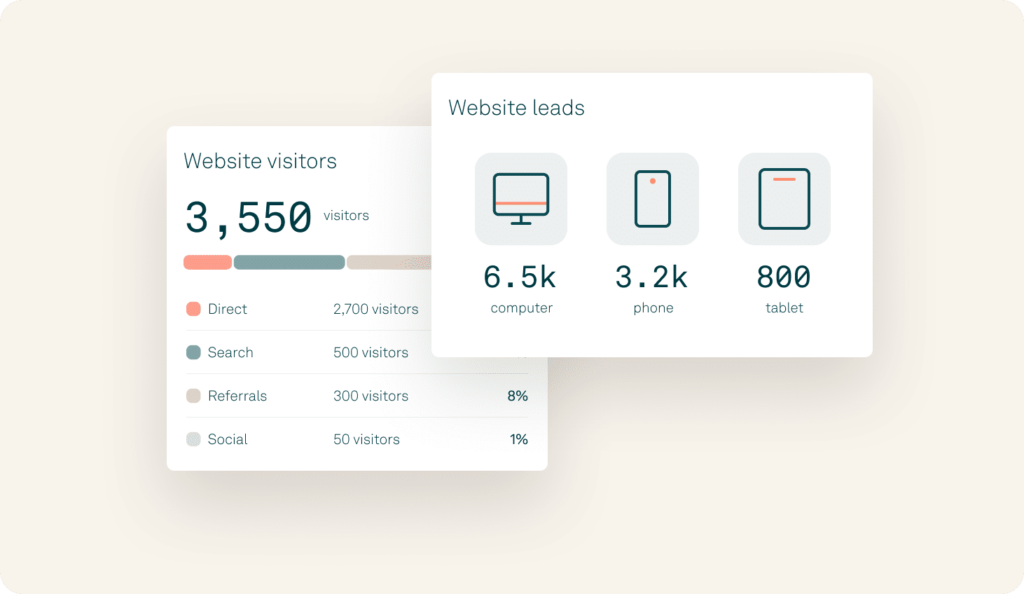
Get real-time insights into patient behavior
Better understand how patients find your practice and interact with your website. View site statistics and get an understanding of your website visitors.

Track your website’s SEO performance
View your search result rankings across Google, Bing, and Yahoo, all in one place.
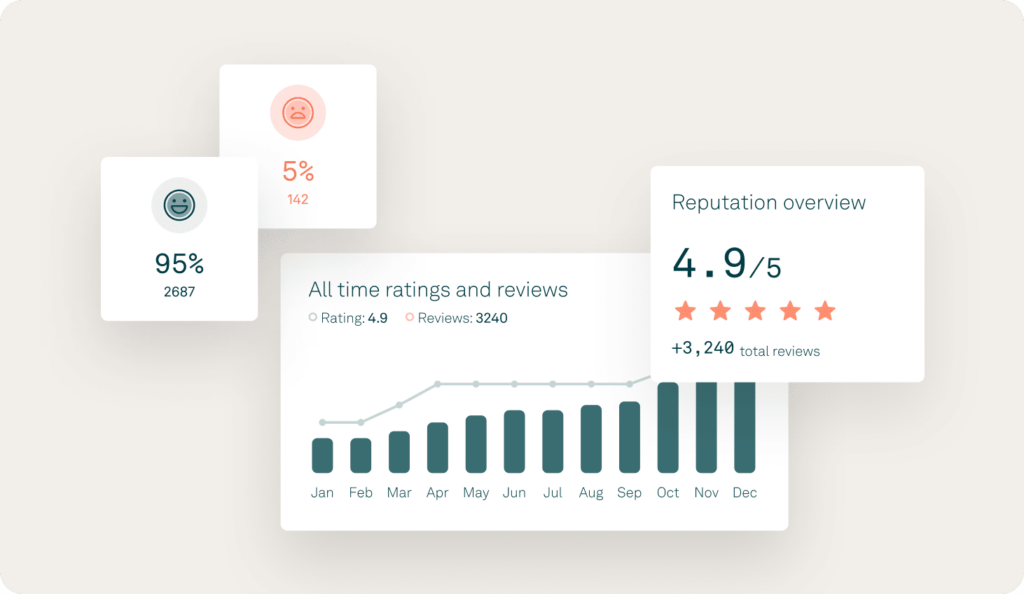
Easy-to-manage online reputation
Get comprehensive visibility into your star ratings and reviews on the most popular review sites. Keep a pulse on your incoming patient reviews and respond directly from the platform.
“Our new system has [...] opened up more time for me to spend with patients, which is what we all want.”
Dr. Robert A. Krause, MD

0 %
patient satisfaction
0 %
fewer no-shows
0
star rating
Read on